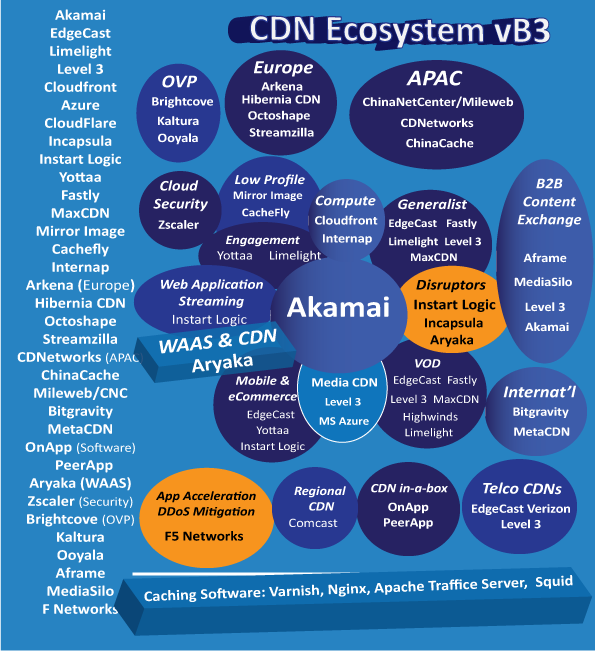
Bizety continues to update the CDN Ecosystem Diagram as new information is received. Below is the latest visualization of CDN and CDN-like players in the Ecosystem. The purpose of the diagram is to illustrate where each company stands in the Ecosystem. Although it is not a perfect illustration by any means, it is the most up-to-date, and accurate representation of all CDN diagrams published anywhere. The orange circles in the diagram reflect the additions that have been made. Here is a snapshot:
Incremental Updates to the Diagram
- F5 Networks was added to the mix, since their appliances offer CDN like functionality including WAF, Global DNS Services, application delivery and load balancing. In addition, they now offer cloud based DDoS Mitigation Services
- CDN Disuptors are the new companies in the Ecosystem that leveraged CDN like infrastructure to offer brand new services, products and business models