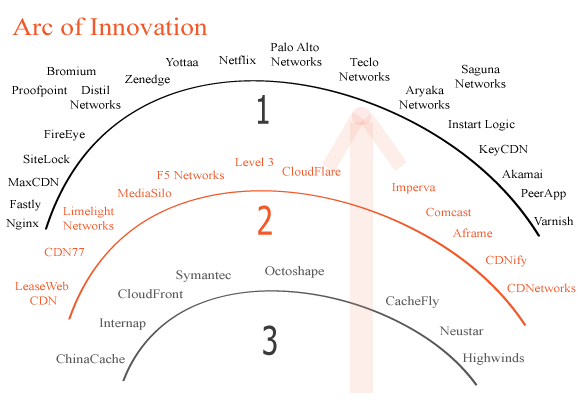
Measuring innovation within the Content Delivery Infrastructure Ecosystem is a very difficult task. Therefore, we’ll give it a shot. We created a diagram that classifies companies into categories of innovation, with # 1 being the most innovative. The best way to measure innovation is to compare companies against each other. The #1 group are hell bent on innovation, continuously introducing new features and services, and betting the house on it. The #2 group are the companies doing a great job at innovation, learning how its done from the # 1 group. Finally, the # 3 group is content in life, and their position in the marketplace. Sometimes companies elect to follow the leaders, creating features after they’ve been on the market for a while, as there is nothing wrong with the safe approach.
Categorizing Innovation
- #1 Group: Includes public companies like Akamai, and start-ups like Aryaka Networks, who plans on going public, and totally disrupting the global WAN sector, creating a multi-billion dollar behemoth in the process
- # 2 Group: Includes companies like Level 3. Level 3 is a large global carrier innovating at a furious pace for a company of its size, having recently developed Content Exchange and DDoS Mitigation capabilities
- # 3 Group: Includes companies like Highwinds and Internap. They are doing well financially, and playing the game conservatively. They don’t have grand plans of disrupting entire markets, and taking over the world

- We don’t take company size or amount of R&D into consideration, since a lot of the innovation is done at the start-up level
- Diagram doesn’t include every company in the Ecosystem

